
Quick answer
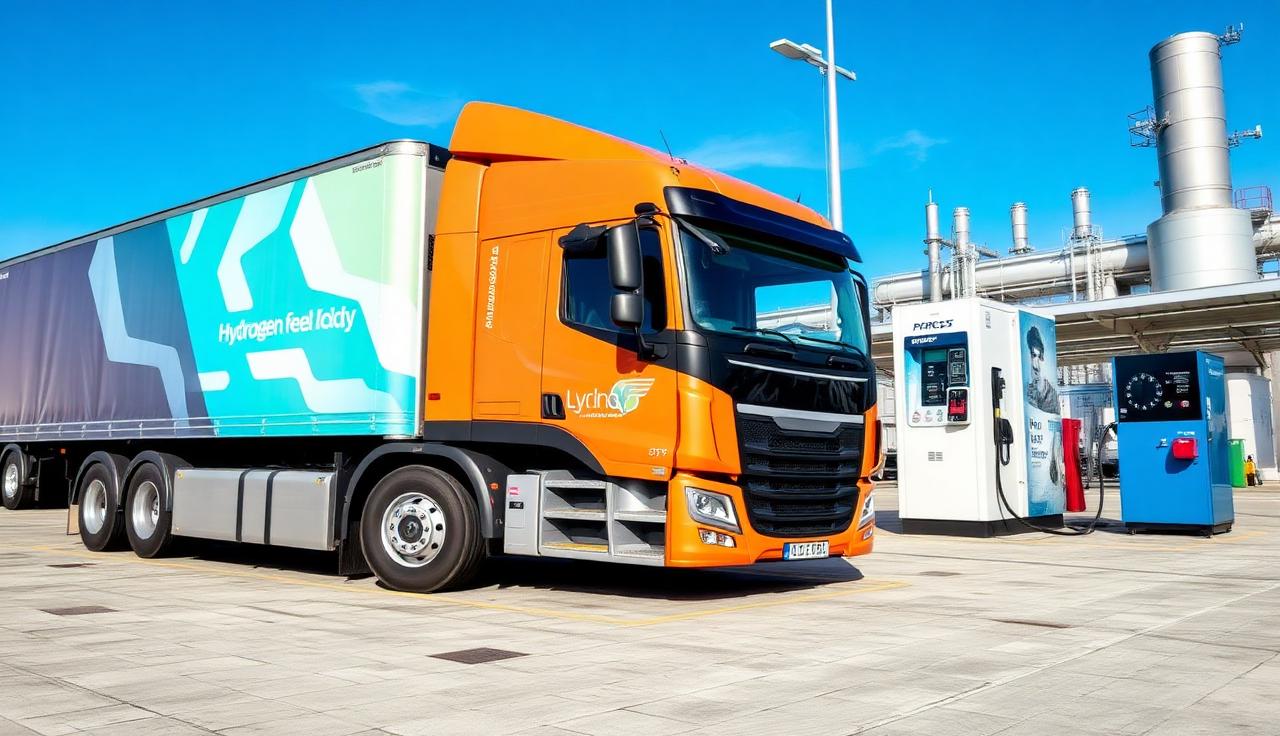
Hydrogen fuel cell electric vehicles (FCEVs) are operating in limited fleet pilots — mostly Class 8 drayage trucks in California ports, transit buses, and a handful of regional haul lanes. Pump prices have been volatile and high ($9–$18/kg observed in 2024–2025), and public hydrogen stations are concentrated in California with limited buildout elsewhere. Plan hydrogen as a duty-cycle decision, not a fleet-wide replacement.
How fleets think about hydrogen vs. diesel and BEV
| Diesel | Battery electric (BEV) | Hydrogen FCEV | |
|---|---|---|---|
| Refuel time | ~10–15 min | 30 min–8 hr | ~15–20 min |
| Range (heavy duty) | 700–1,200+ mi | 150–330 mi today | 350–500 mi today |
| Infrastructure | Ubiquitous | Growing, depot + corridor | Sparse, California-led |
| Fuel price stability | Volatile but liquid market | Most stable (utility rates) | Volatile, limited supply |
| Maintenance | Baseline | Lower (no engine) | Lower; fewer moving parts |
Where hydrogen makes sense first
- Heavy-duty regional haul with predictable routes and a captive fueling location.
- Port drayage where charging dwell time is hard to fit into duty cycles.
- Transit operations with central depots that can host on-site hydrogen.
- Operators in regions with policy support (LCFS credits, CARB incentives).
What's blocking broader adoption
- Pump price. Many California retail sites have seen $30+/kg in recent years; even at $9–$12/kg the per-mile fuel cost is often above diesel.
- Station coverage. Public heavy-duty hydrogen stations are concentrated in California; long-distance routing is constrained.
- Truck supply. OEM availability remains pilot-scale.
- Green vs. gray hydrogen. Lifecycle CO₂ depends heavily on how the hydrogen is produced — verify supplier disclosures before claiming reductions.
What to do today
- Identify 1–3 duty cycles that could plausibly fit FCEV constraints.
- Run a parallel BEV evaluation on the same routes — many fleets find BEV economics close faster.
- Model fuel cost as a range ($9–$18/kg) rather than a point estimate.
- Use the Fleet TCO model to compare diesel, BEV, and hydrogen scenarios on cost per mile.
About these numbers
Pump prices reflect public data from CARB, the California Hydrogen Fuel Cell Partnership, and operator disclosures. Ranges are 2024–2025 directional values, not guarantees. Energy density and efficiency comparisons are approximate; verify against your OEM and supplier for any procurement decision.